Error queue
From time to time an error can pop up in your environment. To track such errors and make them insightful, we've created a chapter in Suite which lists these for you.
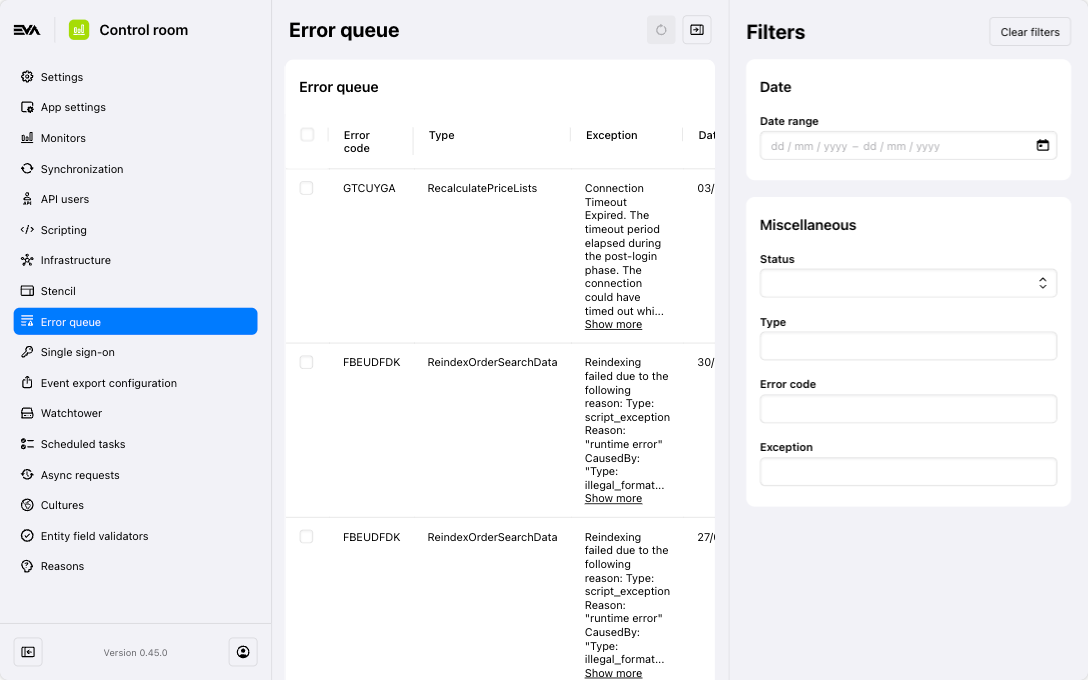
The Error queue chapter can be found in the Control room. The list can contain thousands, or even millions, of entries, so be sure to make good use of the filter sidebar.
In the overview you can select errors and click the republish icon which will become visible in the top right after selection. This will fire off the message once again. If you do, its status will change from New to Republished to (potentially) Failure after retry to Republished, etc.
Each status is color coded whereas New is blue, Republished and success after retry will be green, and Failure after retry and ignored will be red.
This chapter requires the ErrorQueue functionality.
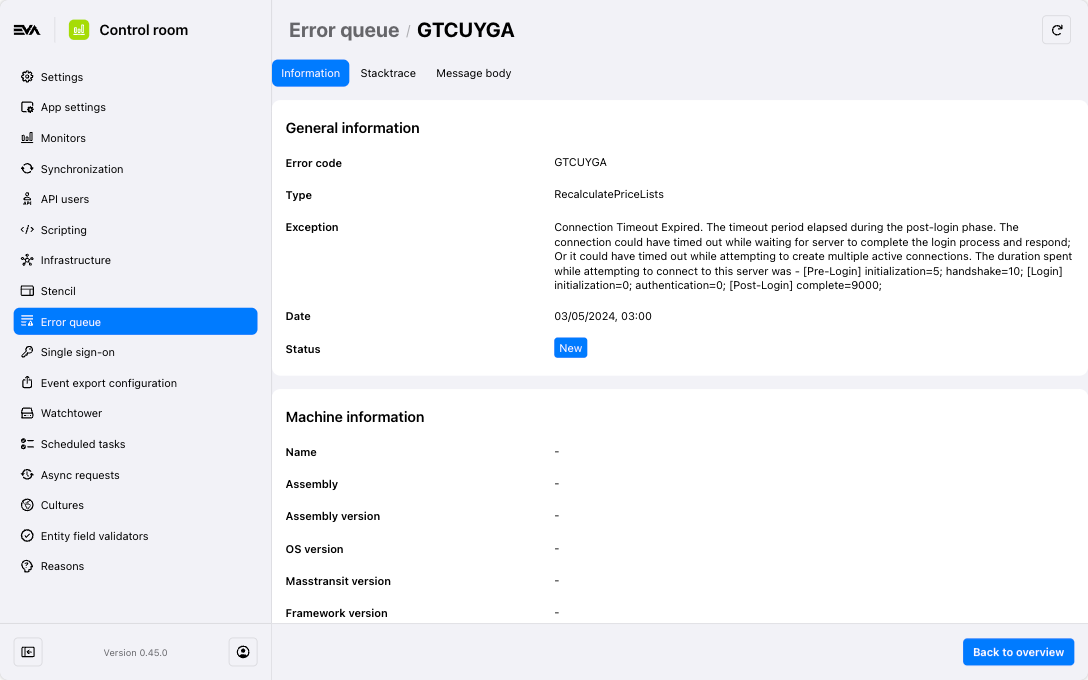
By opening an error, you can find all of its details. This includes the original error message for reading at your leisure, while including additional Machine information (if applicable). This makes potential troubleshooting a lot easier.
Each tab in the error's details has an action button in the footer allowing you to Republish.
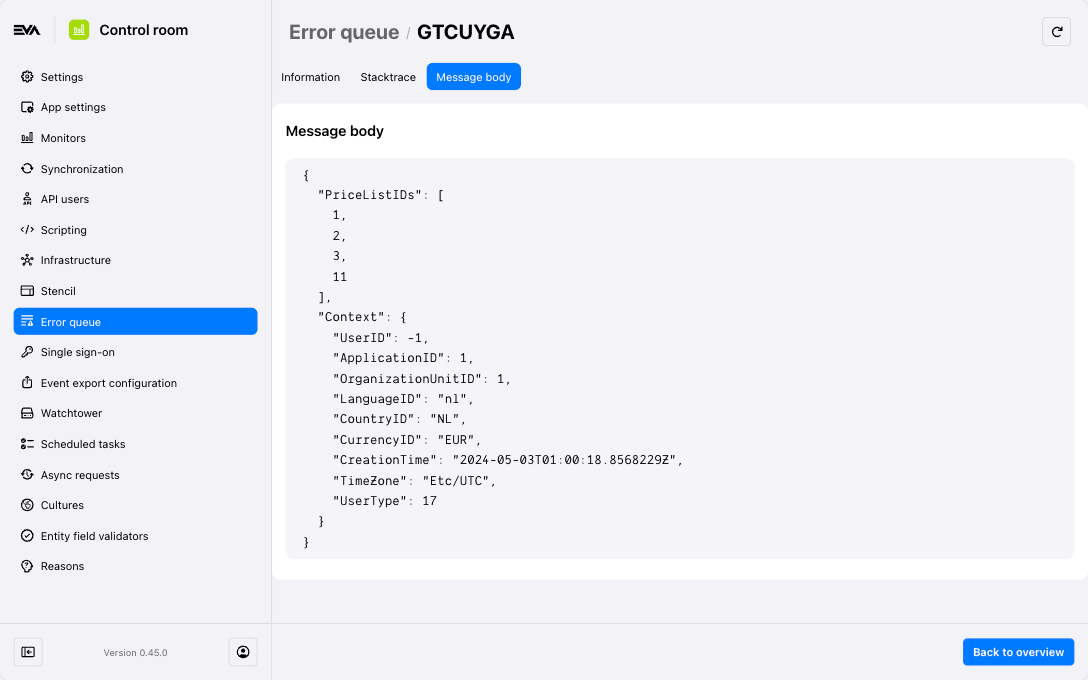
By checking the Message body you can see what exactly was sent (and failed) in a read only code block which makes for easy reading. In our example case below, you can see it concerns an EventExportMessage.