Monitors
Admin Suite features a module wholly dedicated to monitoring your operations. This ranges from watching your orders to your settings, giving you insight as well as warnings whenever something is vulnerable or has gone askew. With its dashboard divided into several handlers, you can fine-tune what areas of your EVA setup you want to monitor.
There's two functionalities when it comes to monitors, namely Monitors and MonitorNotifications.
Dashboard
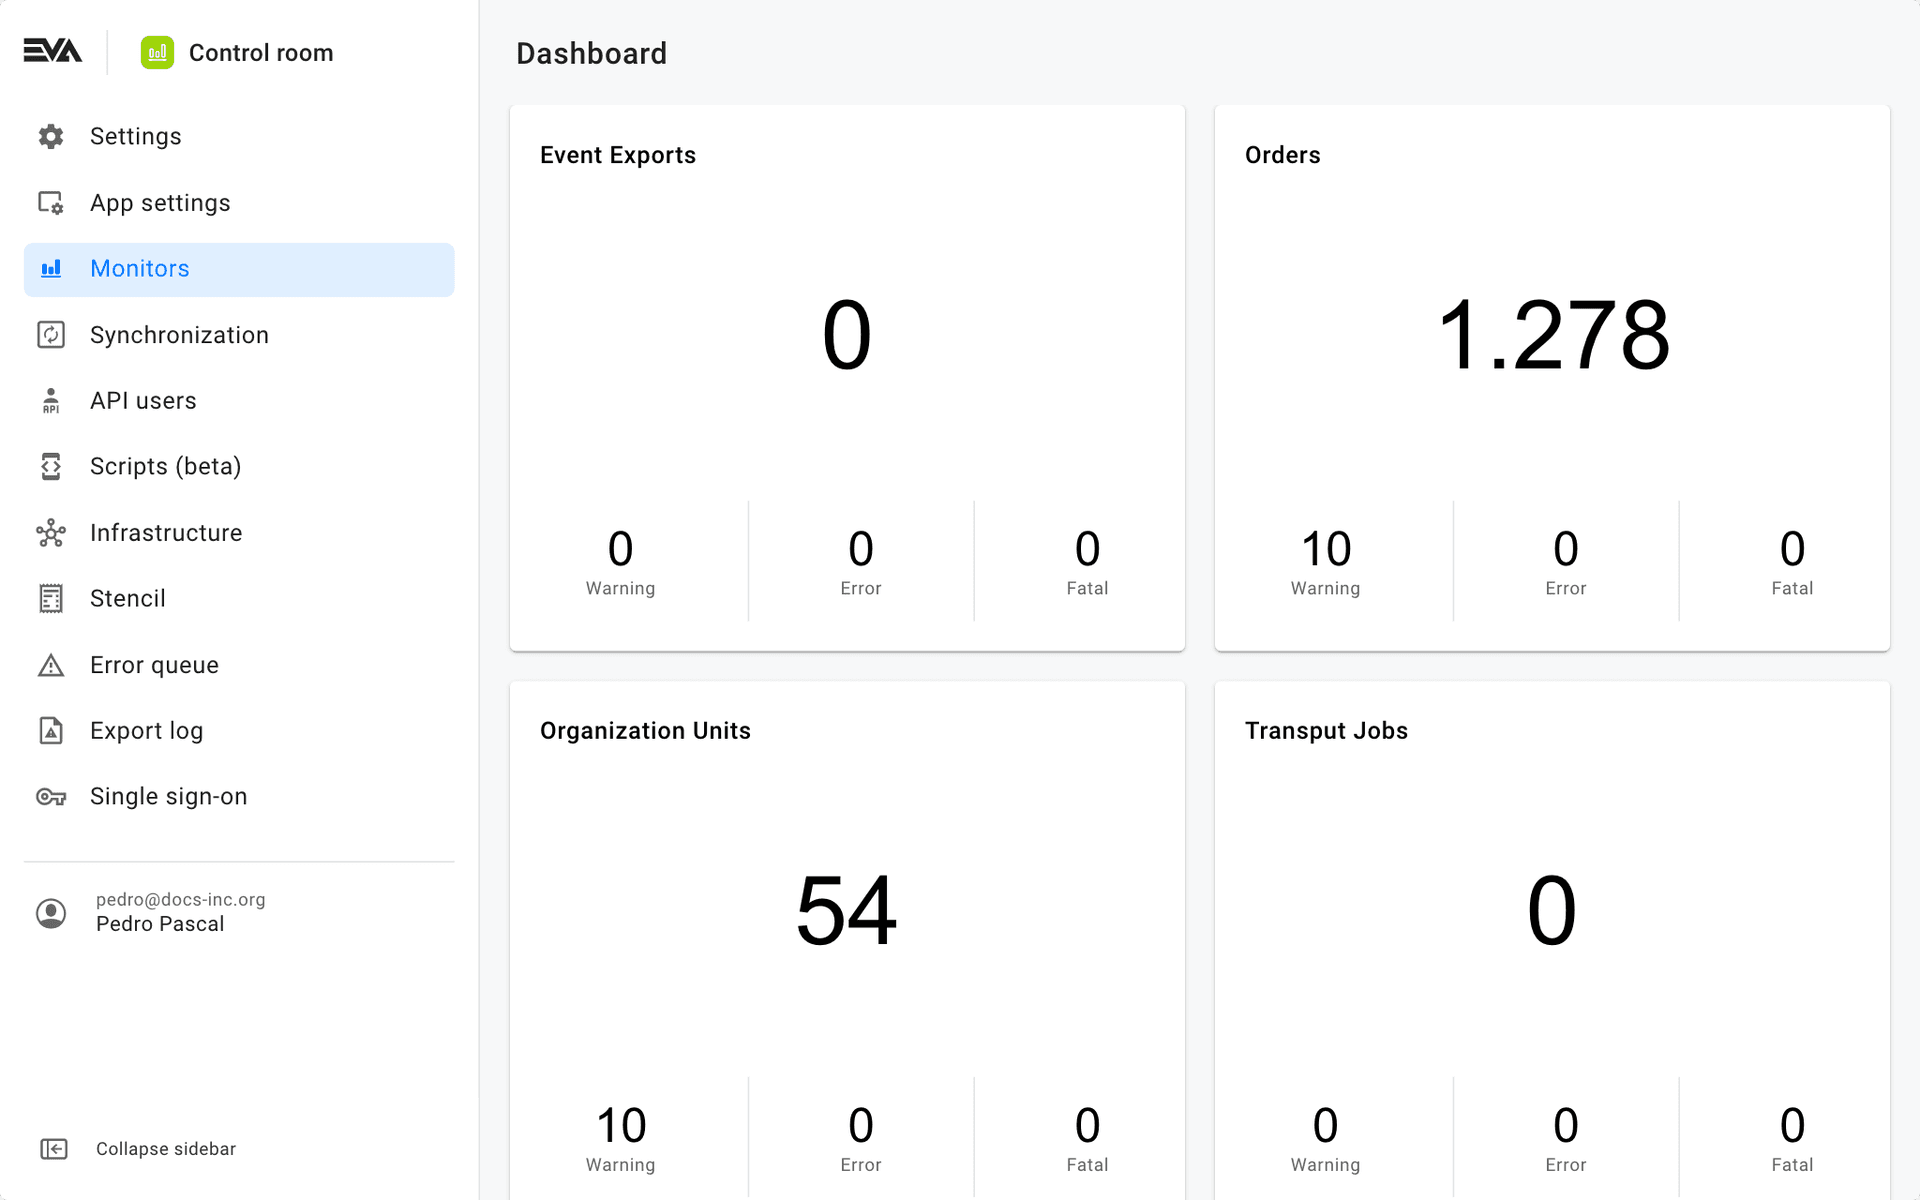
The Dashboard area shows all available handlers for monitors, with each giving you a quick overview of the amount of Warnings, Errors and Fatal outcomes. Currently available handlers include:
- Event exports;
- Orders;
- Organization units;
- Payment settlement files;
- Transput jobs -jobs related to your Export logs;
- Setting vulnerabilities;
- Scripted orders;
- Watchtower;
- Product search
As you can see in the image below, each category features a large number in the middle, which signifies the summed up amount no matter their levels - this also includes the Info level, which isn't displayed anywhere else. Due to the info level, this big number displays a number that's different from the sum of Warning, Error and Fatal counts that are shown underneath.
- No error: Green
- Information: Gray
- Warning: Yellow
- Red: Error
- Fatal error: Black
The image above shows some of the handlers currently available in our environment. Not all of them are interactive, such as Setting vulnerabilities. In such a case, the handler will show what's important to EVA by default, while not allowing for the creation of custom monitors.
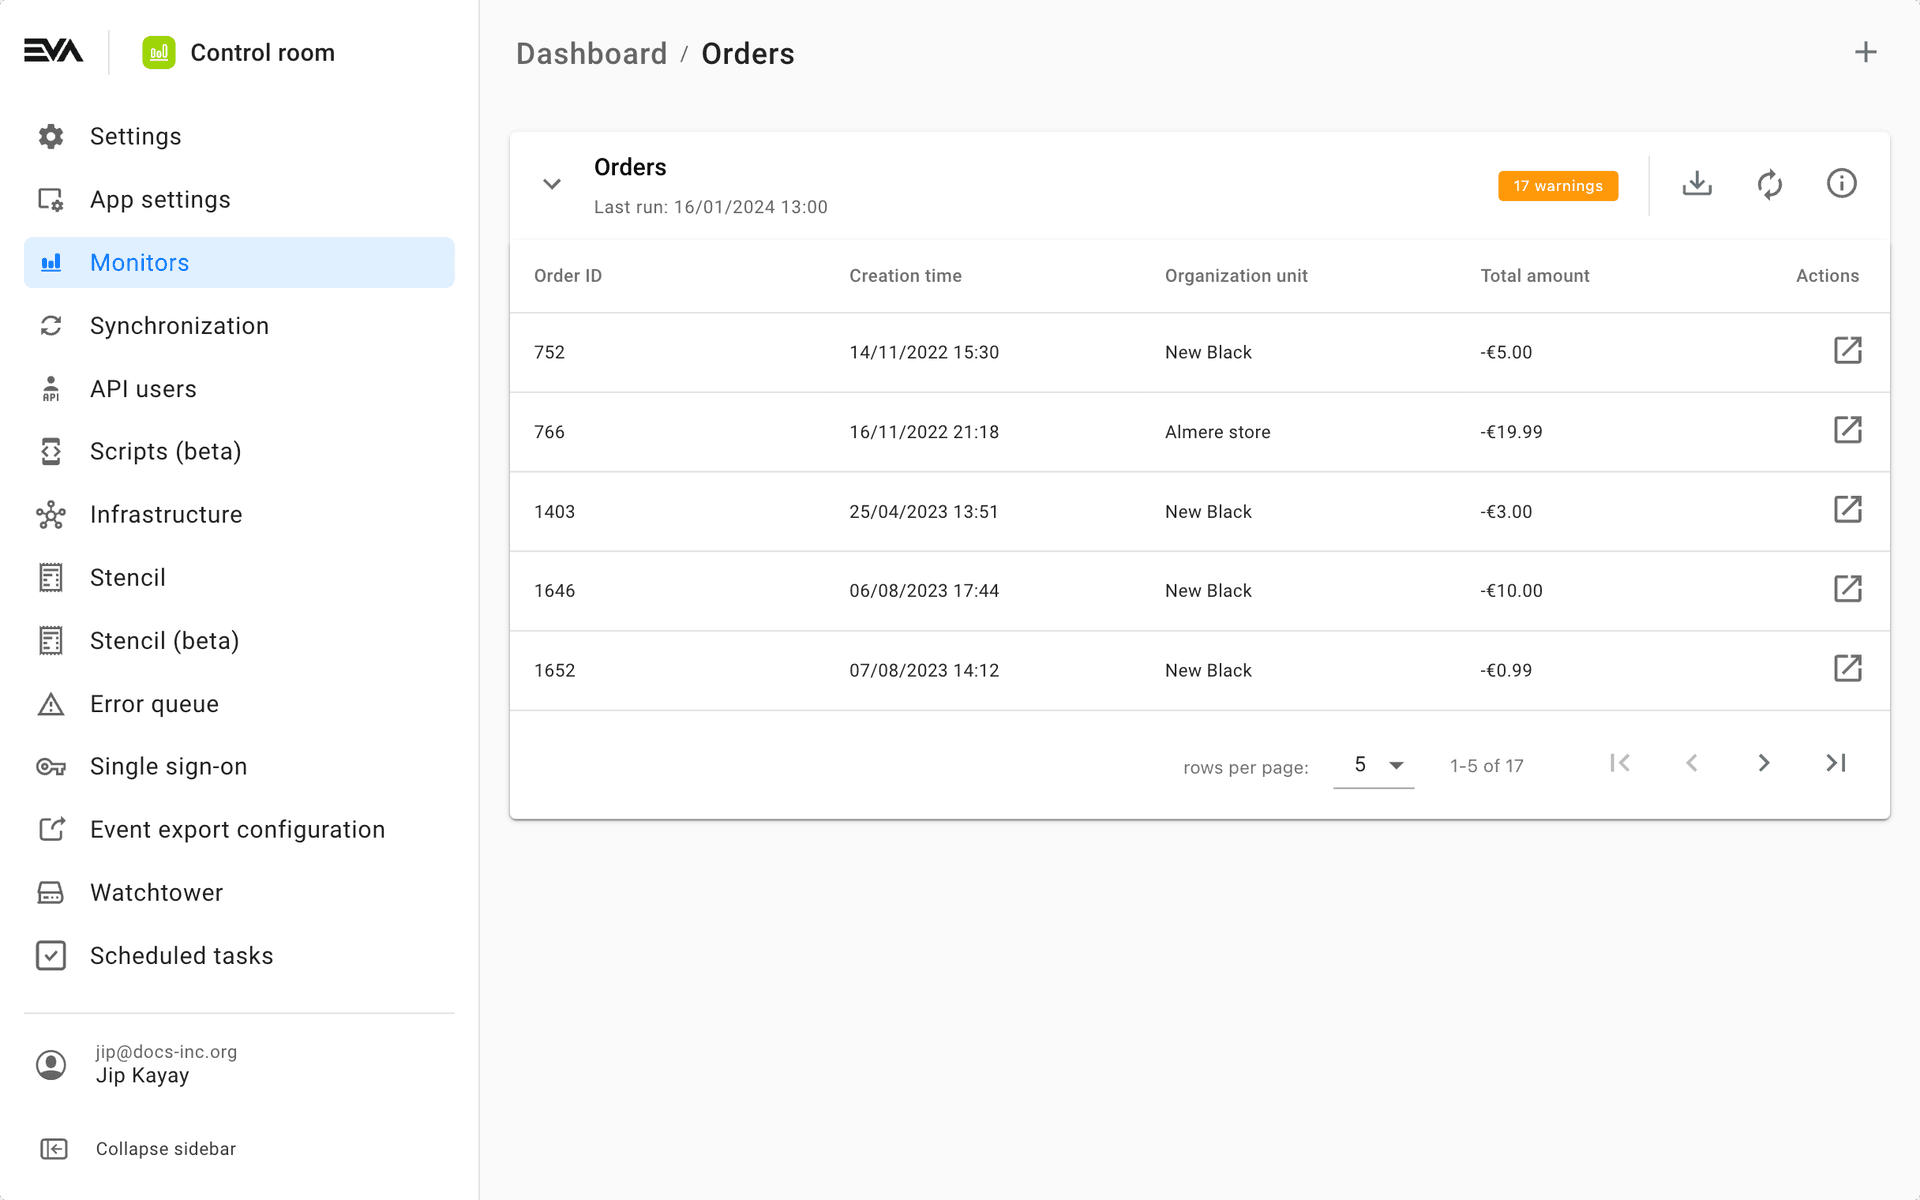
If you open a handler, such as Orders, you'll get an overview all its created monitors. By using the 'download' icon you can get an Excel containing all the results of the latest run of the monitor.
Create
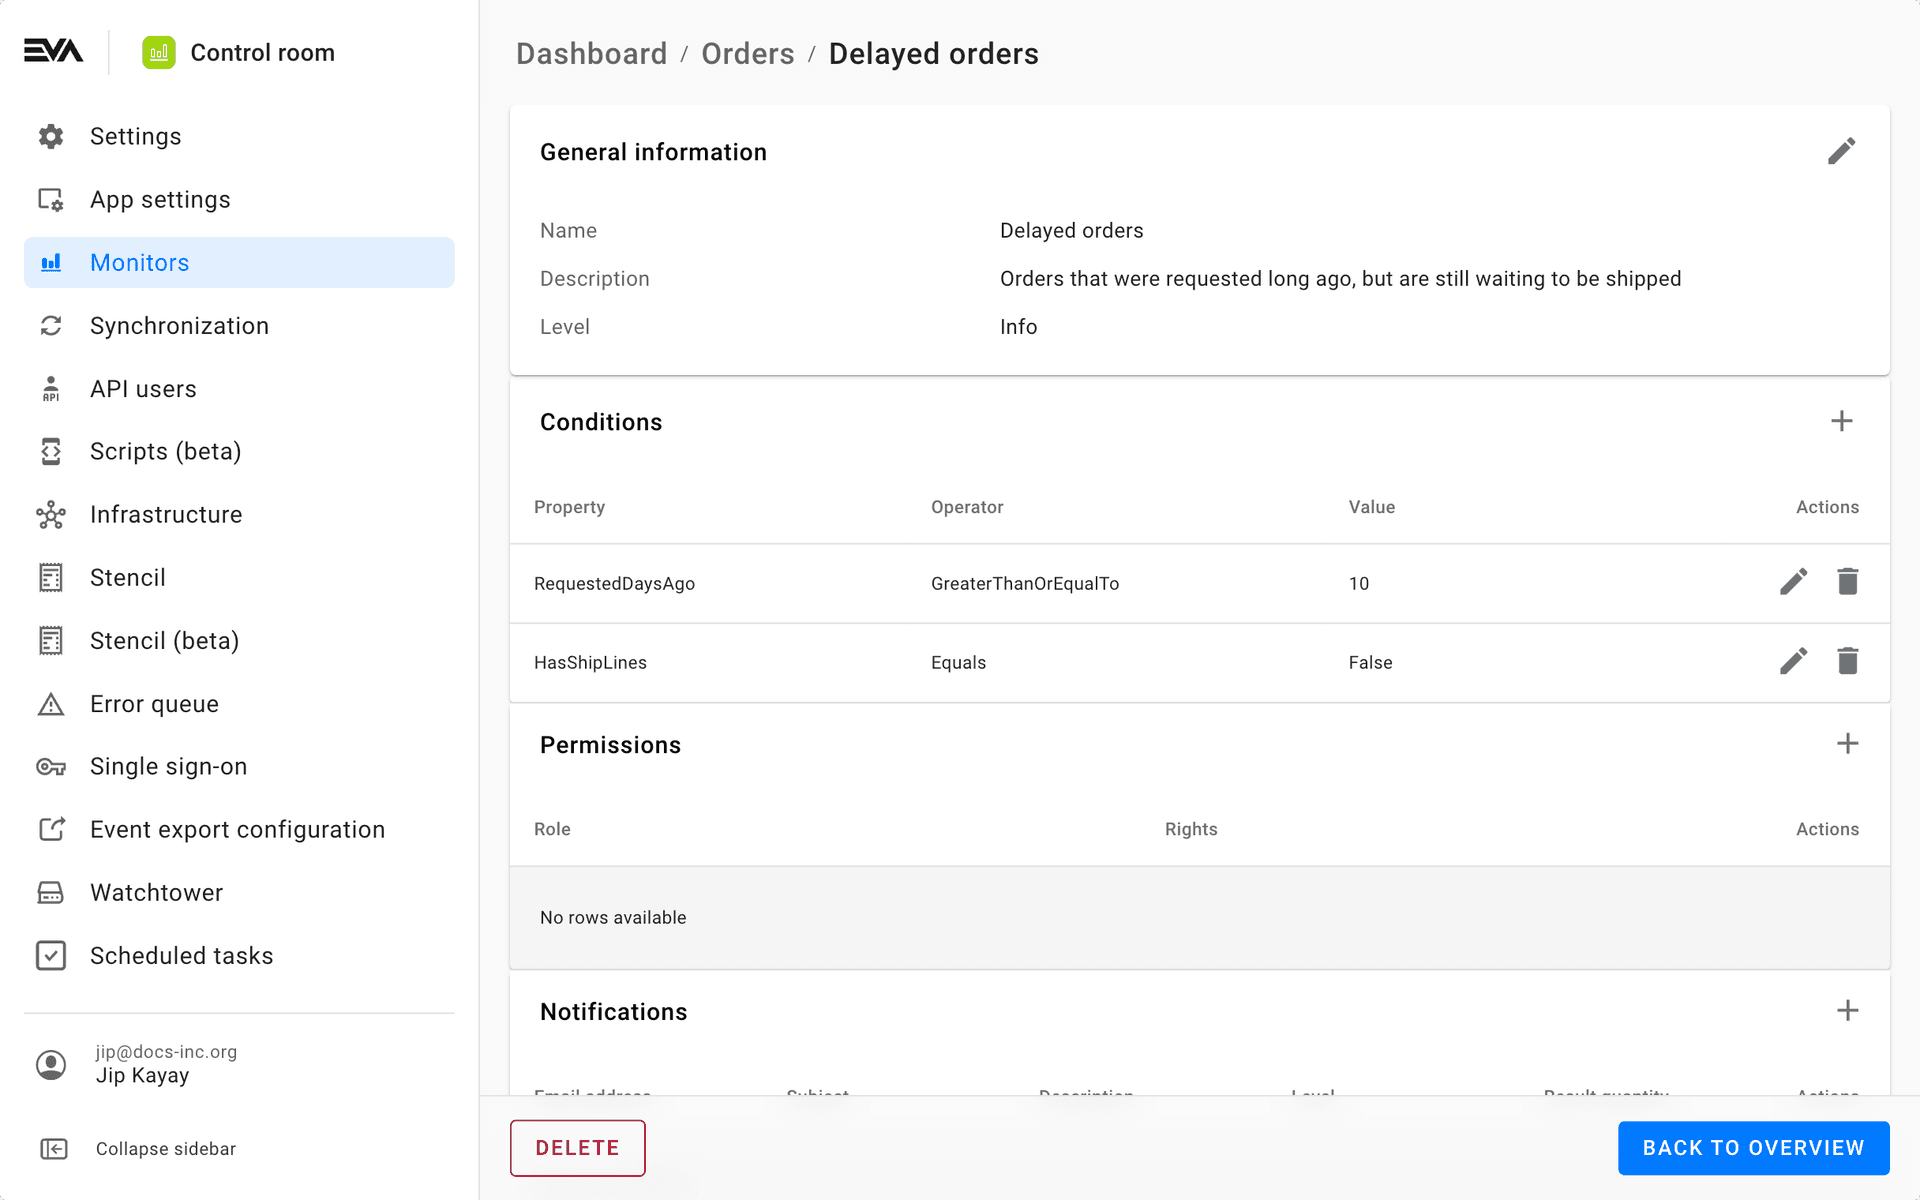
The following image shows you a setup of a single condition in the Orders category. It involves tracking orders which ought to have been shipped by now, which is specified by means of the two properties you can see in the Conditions table.
From top-to-bottom, the following fields are used to create a condition in all monitoring categories:
- Name: the name by which the rule will be displayed in the category's overview;
- Description: the description to be shown in the rule's details (i icon);
- Level: there are four different levels of importance to ascribe to a rule, which correspond to where on the table the results of the rule will be displayed (e.g. warning) - these are visual indicators only and serve no other purpose.
The fields featured in the Conditions table are also constant across the monitor categories:
- Property: depending on which category you are in, several properties will be shown, such as RequestedDaysAgo in the Orders monitor or DaysOld in the Payment Settlement Files
- Operator: the operator lets you determine how to handle the specified property, e.g. the property must be GreaterThan
- Value: the possible values will depend on the operator chosen above
You can add and combine as much properties as necessary for your desired monitoring results.
Permissions AKA privacy
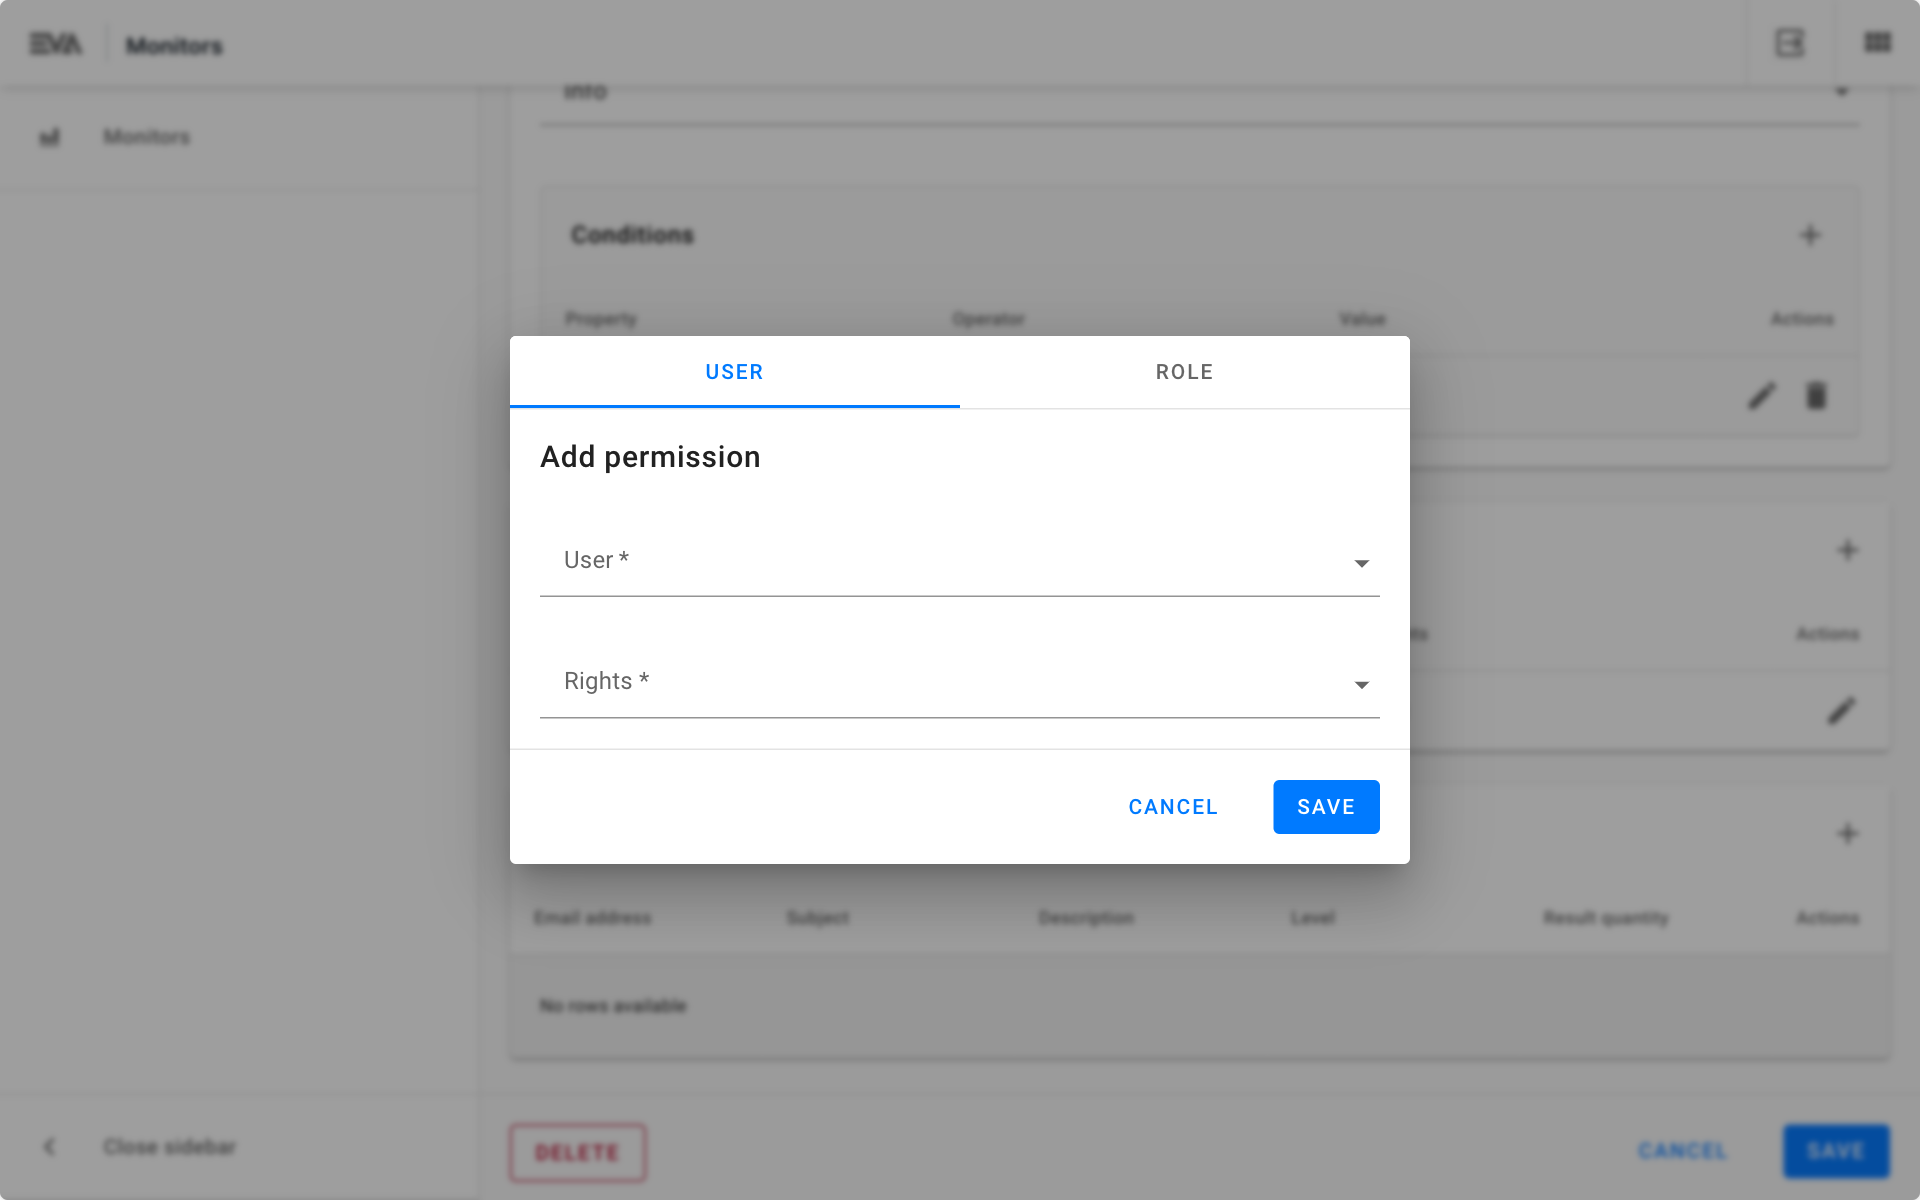
After having created the condition(s) of the new monitor, you can set permissions for it. By default, a created monitor is private. This means that only the role as creator will be able to see it.
By changing the permissions for this monitor, you can add more Users, or entire Roles, that will be allowed to Edit and/or View this monitor.
Notifications
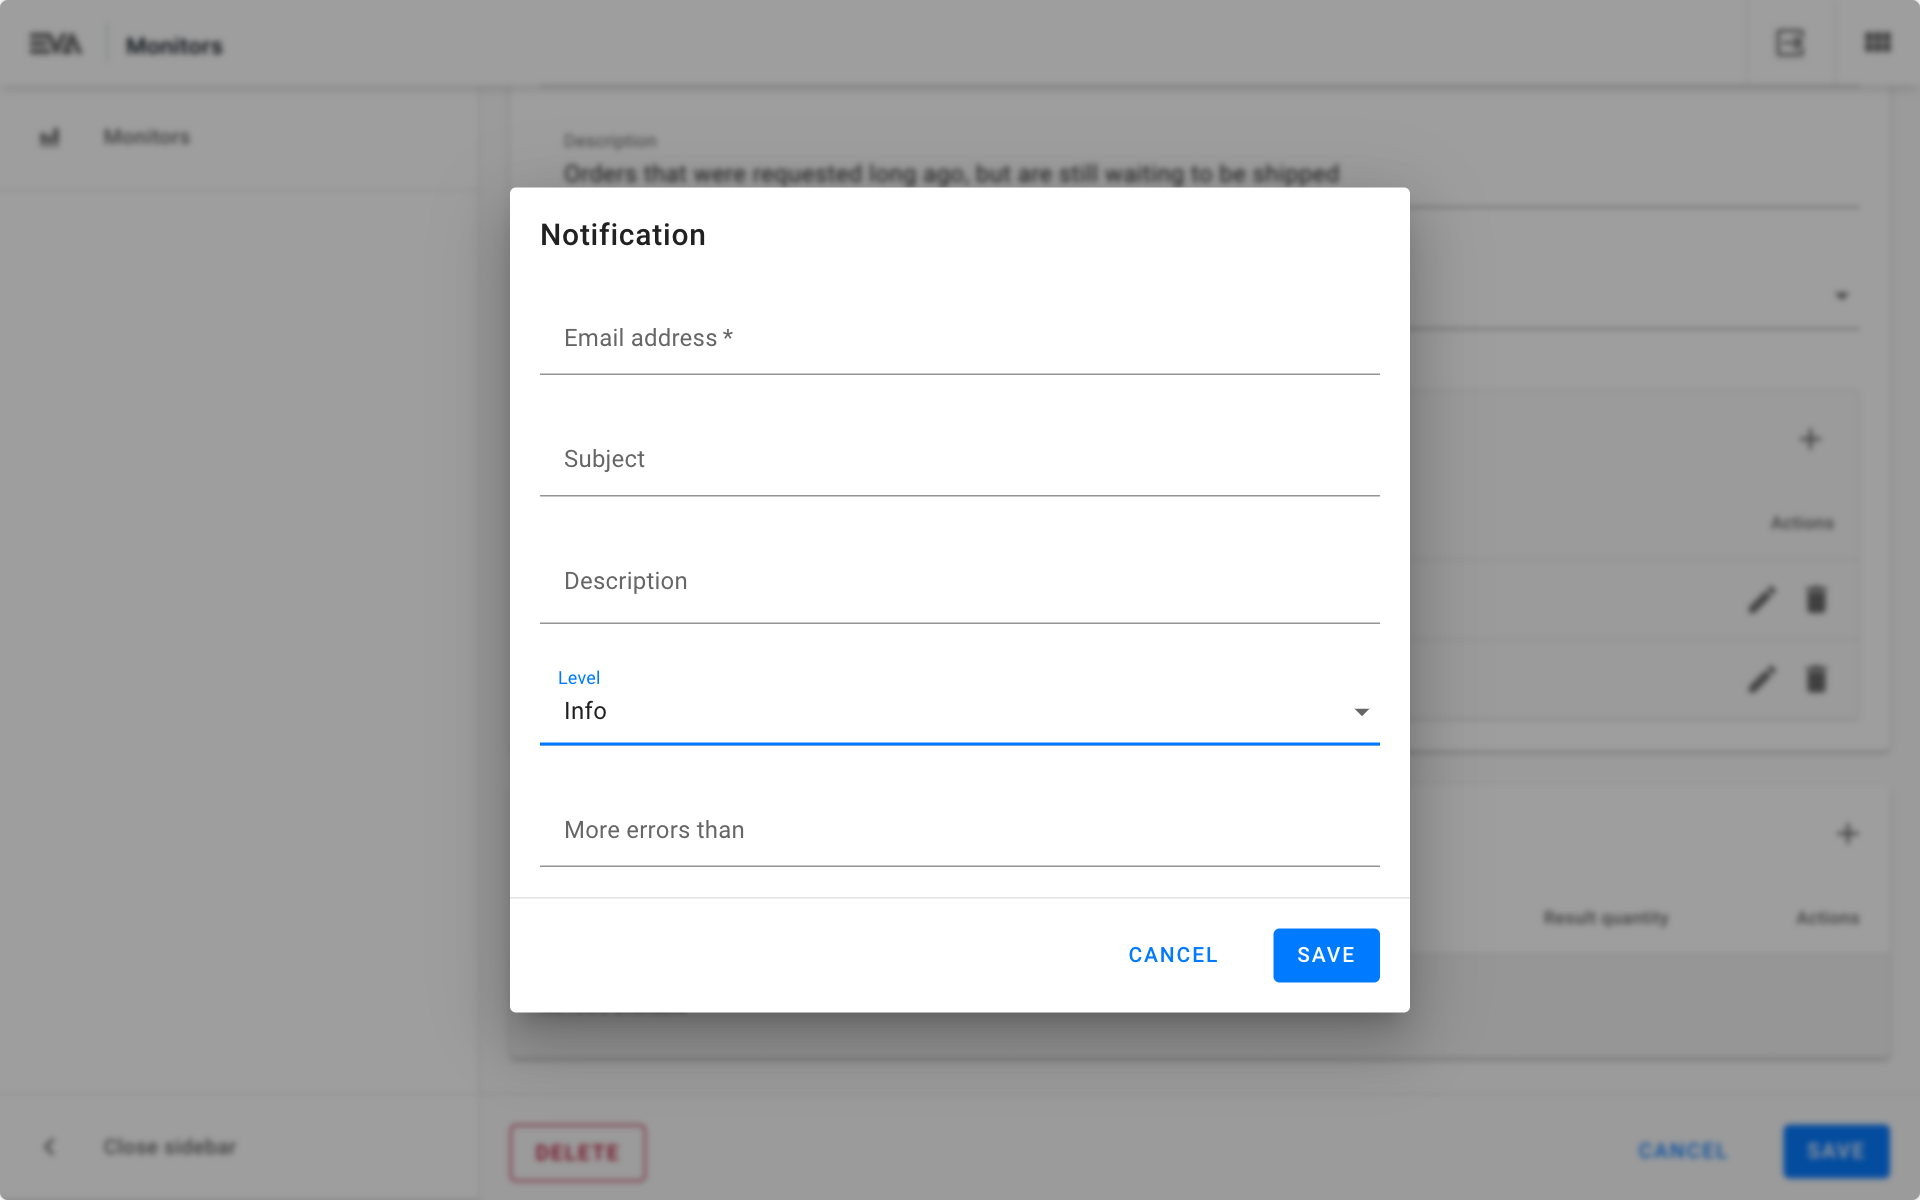
You can also set notifications for your monitor. It allows you to set a threshold for the results of the condition which, if exceeded, will ensure you are notified by email. You can add as many email addresses as you like.
Although the configuration of the notifications themselves can be done here easily, some additional setup is required in order to actually send the notifications. For now this is done in Admin 1.0's Stencil chapter. While we're working on a more user-friendly method, we've made an example which you can use to set up a stencil. We advise setting up the stencil before the configuration of notifications.
Setting up a stencil for notifications
Any notifications that have been created before the setup of the stencil will not take advantage of it.
Steps:
- Create a stencil of Type: Template
- The Organization should be your top-level OU
- Choose MonitorNotification under Name
- Leave Country, Language and Layout empty
- Destination should be Mail, leave the rest empty
Now paste the following text into the Content tab:
<style>

    .result_wrapper span {
        padding:5px;
        display:inline-block;
    }

    .result_wrapper span.level {
        font-weight:bold;
    }

    .result_Info {
        background-color:#d9e8fd;
    }
    .result_Warning {
        background-color:#fdf7d9;
    }
    .result_Error {
        background-color:#fdd9d9;
    }
    .result_Fatal {
        background-color:#d23534;
        color:#fff;
    }

    div,table {
        border:1px solid #cfcfcf;
        margin:10px;
        font-family:arial;
        color:#797979;
    }
    p {
        margin:10px;
    }
    table.orders {
        border-collapse: collapse;
    }
    th, td {
        border:0px;
        border-bottom:2px solid #cfcfcf;
        padding: 5;
        margin: 0;
    }
    td {
        border-bottom:1px solid #cfcfcf;
    }

</style>

<div>
    <p>Hi!</p>
    <p>This is an automated message from the monitor: {{>Monitor.Name}} </p>
    <p>Notification: {{>Notification.Description}}</p>
    <p><b>Notification(s):</b></p>
    <div>
        {{:~ParseMonitorData(LastResult.Data,Notification.Level)}}
    </div>
</div>
Now paste the following text into the Helper tab:
function ToJSON(data) {
   return "<div>" + JSON.stringify(data) + "</div>";
}

function ParseMonitorData(data, level) {
   var output = "";
   if (data.hasOwnProperty("Vulnerabilities")) {
       data.Vulnerabilities.forEach(item=>{
           output += CreateVulnerabilityMessage(item,level);
       });
   }
   if (data.hasOwnProperty("Orders")) {
       output += "<table class='orders'><tr>";
       output += "<th class='level_header'>Level</th>";
       output += "<th>Order ID</th>";
       output += "<th>Creation time</th>";
       output += "<th>Organization unit</th>";
       output += "<th>Total amount</th>";
       output += "</tr>";
       data.Orders.forEach(item=>{
           output += CreateOrderMessage(item,level);
       });
       output += "</table>"
   }
   if (!data.hasOwnProperty("Orders") && !data.hasOwnProperty("Vulnerabilities")) {
       output += "<div class='result_wrapper result_" + level + "'><span class='level'>" + level + "</span>";
       output += ToJSON(data);
       output += "</div>";
   }
   return output;
}

function CreateOrderMessage(data, level) {
   var output = "<tr class='result_" + level + "'>";
   output += "<td class='level'>" + level + "</td>";
   output += "<td>" + data.ID + "</td>";
   output += "<td>" + data.CreationTime + "</td>";
   output += "<td>" + data.SoldFromOrganizationUnit.Name + "</td>";
   output += "<td>" + data.CurrencyID + " " + data.TotalAmountInTax + "</td>";
   output += "</tr>";
   return output;
}

function CreateVulnerabilityMessage(data, level) {
   var output = "<div class='result_wrapper result_" + level + "'><span class='level'>" + level + "</span>";
   output += "<span>" + data.OrganizationUnit.Name + " has a vulnarabilty on the '" + data.Key;
   output += "' setting, value should be '" + data.CheckValue + "' but the current value is '" + data.Value+ "'</span>";
   output += "</div>";
   return output;
}
Category overview
Each handler has its own overview with differing columns, best suited to the results of its conditions. What is similar however, is the circular 're-run' icon in the top right of each condition. This will let you do another check on what you specified in that condition - it can take a few minutes to complete a run.
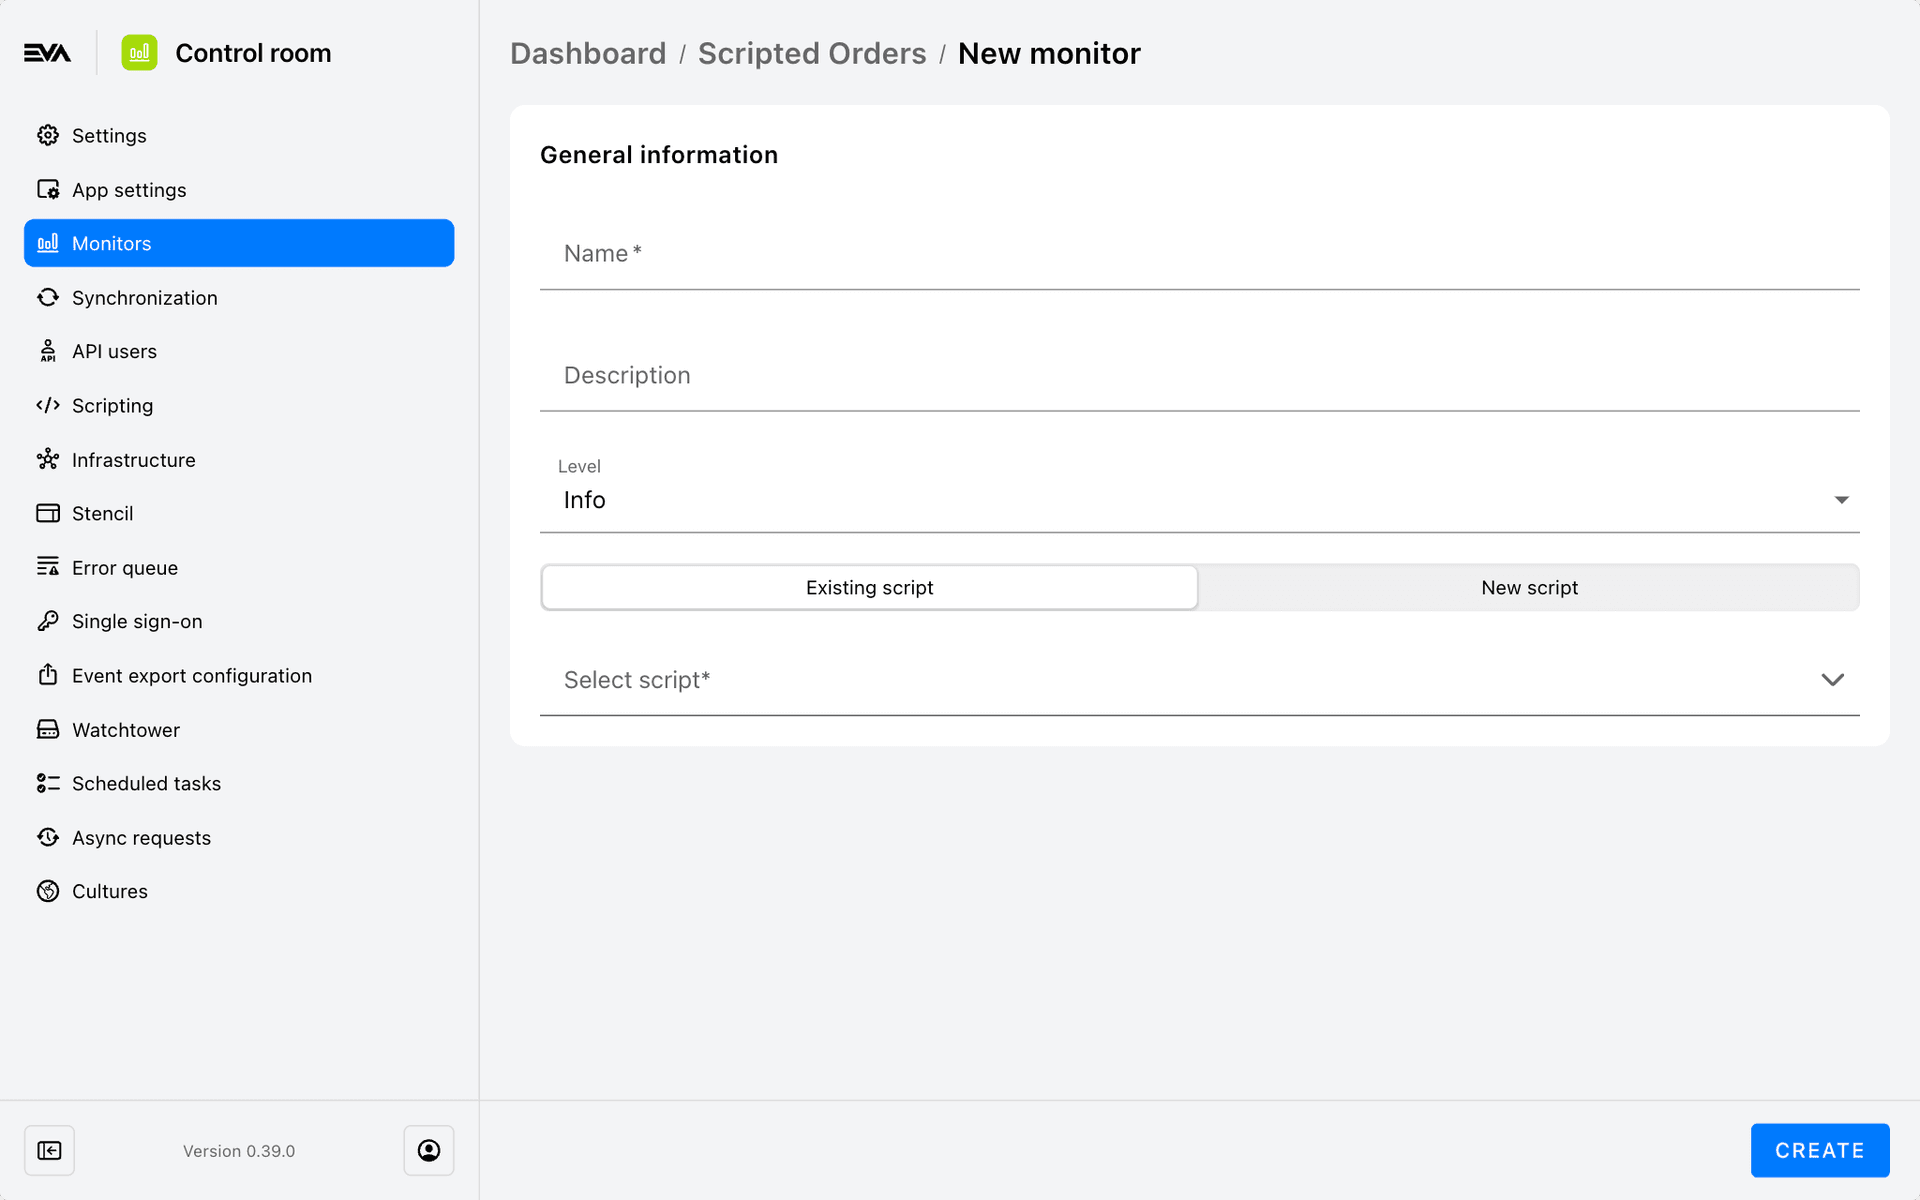
Scripted orders
The scripted orders monitor allows you to create advanced order monitors where a script verifies if an order is applicable for monitoring or not. As such, the script lets you specify the desired order property that would then qualify an order for monitoring.
This monitor requires a script to be linked. Therefore, first create your OrdersMonitor script from the Scripting chapter using the Orders Monitor extension point. The script will then be visible in the dropdown list when selecting a script using the Existing script button.
Alternatively, you can also create one from here using the New script button.